Concept preview. Not indexed. Facts are checked against the sources listed on each page.
How much space debris is in orbit?
As of October 17, 2026, the GCAT catalogue tracks 34,337 objects in Earth orbit. 20,070 are payloads, working or not, and the other 14,267 are spent rocket stages (2,111), fragments of debris (10,698) and small components (1,458).
34,337
Tracked objects in Earth orbit
10,698
Pieces of debris
2,111
Spent rocket bodies
42%
Not working satellites
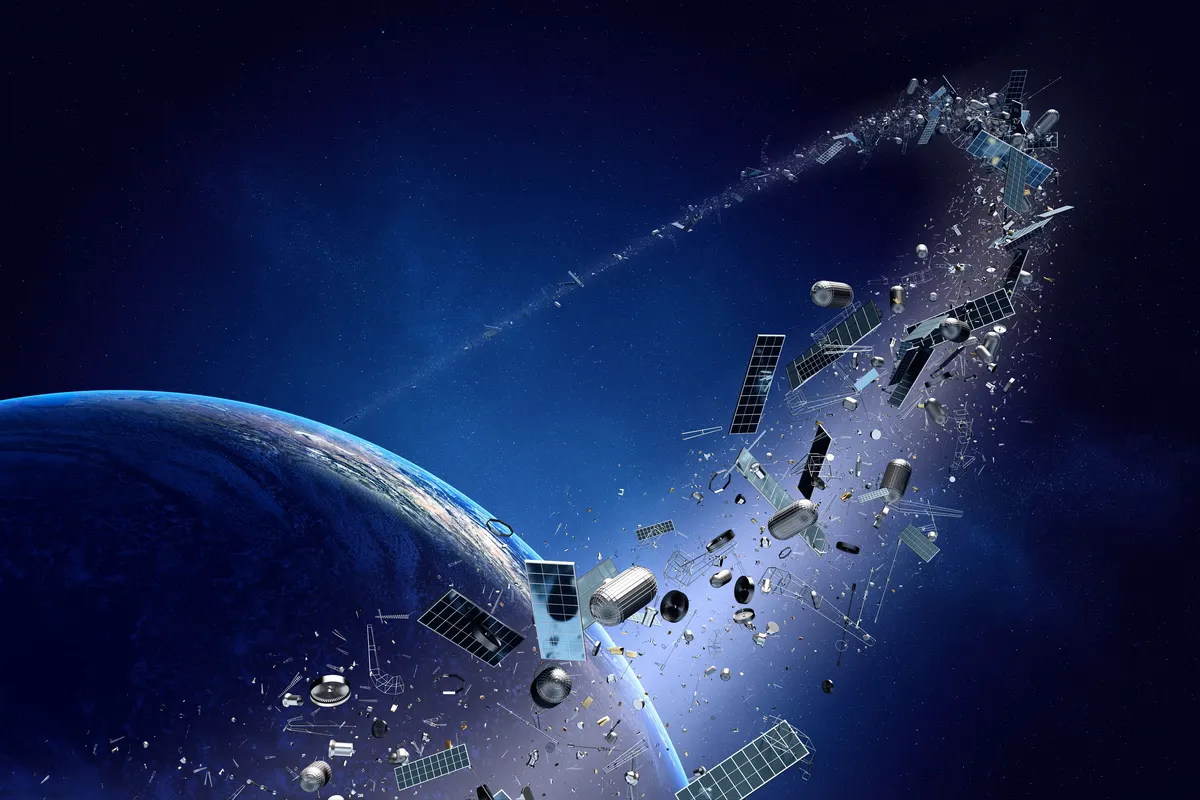
What is up there
Only objects big enough to be tracked are counted. There are many more fragments too small to catalogue.
How the total has changed
At the end of 1990 the catalogue held 12,330 objects in Earth orbit. At the end of 2025 it held 31,661.
All tracked objectsDebris, rocket bodies and components
Data table
| Year | Payloads | Rocket bodies | Debris | Components | Total |
|---|---|---|---|---|---|
| 1990 | 1,916 | 1,060 | 8,015 | 1,339 | 12,330 |
| 1991 | 1,954 | 1,089 | 8,255 | 1,282 | 12,580 |
| 1992 | 1,993 | 1,135 | 8,549 | 1,285 | 12,962 |
| 1993 | 2,042 | 1,177 | 10,359 | 1,299 | 14,877 |
| 1994 | 2,137 | 1,225 | 11,305 | 1,343 | 16,010 |
| 1995 | 2,212 | 1,259 | 11,519 | 1,349 | 16,339 |
| 1996 | 2,281 | 1,300 | 11,412 | 1,365 | 16,358 |
| 1997 | 2,401 | 1,342 | 11,897 | 1,354 | 16,994 |
| 1998 | 2,522 | 1,360 | 11,731 | 1,337 | 16,950 |
| 1999 | 2,616 | 1,373 | 15,321 | 1,303 | 20,613 |
| 2000 | 2,692 | 1,386 | 15,550 | 1,335 | 20,963 |
| 2001 | 2,710 | 1,387 | 15,708 | 1,263 | 21,068 |
| 2002 | 2,753 | 1,386 | 15,542 | 1,254 | 20,935 |
| 2003 | 2,817 | 1,409 | 15,369 | 1,277 | 20,872 |
| 2004 | 2,870 | 1,424 | 15,281 | 1,316 | 20,891 |
| 2005 | 2,914 | 1,440 | 15,173 | 1,312 | 20,839 |
| 2006 | 2,984 | 1,472 | 15,910 | 1,348 | 21,714 |
| 2007 | 3,072 | 1,503 | 15,898 | 1,396 | 21,869 |
| 2008 | 3,149 | 1,537 | 15,352 | 1,420 | 21,458 |
| 2009 | 3,242 | 1,572 | 15,271 | 1,450 | 21,535 |
| 2010 | 3,317 | 1,607 | 15,089 | 1,484 | 21,497 |
| 2011 | 3,402 | 1,634 | 14,985 | 1,531 | 21,552 |
| 2012 | 3,501 | 1,659 | 14,837 | 1,543 | 21,540 |
| 2013 | 3,665 | 1,690 | 14,578 | 1,582 | 21,515 |
| 2014 | 3,831 | 1,721 | 14,265 | 1,594 | 21,411 |
| 2015 | 3,976 | 1,758 | 13,972 | 1,603 | 21,309 |
| 2016 | 4,118 | 1,790 | 13,903 | 1,609 | 21,420 |
| 2017 | 4,507 | 1,823 | 13,823 | 1,621 | 21,774 |
| 2018 | 4,954 | 1,887 | 14,068 | 1,659 | 22,568 |
| 2019 | 5,263 | 1,917 | 14,103 | 1,658 | 22,941 |
| 2020 | 6,389 | 1,941 | 13,937 | 1,675 | 23,942 |
| 2021 | 8,025 | 1,973 | 13,716 | 1,687 | 25,401 |
| 2022 | 10,086 | 2,024 | 12,709 | 1,659 | 26,478 |
| 2023 | 12,259 | 2,044 | 11,612 | 1,593 | 27,508 |
| 2024 | 13,948 | 2,049 | 11,423 | 1,505 | 28,925 |
| 2025 | 17,304 | 2,082 | 10,796 | 1,479 | 31,661 |
Whose rocket bodies and debris
The countries responsible for most of the rocket bodies, debris and components in orbit.
Where it orbits
Sources and method
- GCAT by Jonathan McDowell, CC BY 4.0. Updated October 17, 2026. Data from GCAT (J. McDowell, planet4589.org/space/gcat).
- Counts use the GCAT current catalogue: objects whose status is in Earth orbit, grouped by GCAT object type (payload, rocket body, debris, component). Year-end counts use launch and decay dates.